我想医生们也还是需要大量进行"传统"的统计学分析的. 这几天正好看到了一个关于贝叶斯分析的PyMC包, 用来做概率计算. 下面的文章里讲解了临床最常见的一些统计应用, 比如参数估计, 组间比较. 看着写起来也不困难, 供参考.
本文翻译自Eric Ma在PyCon2017上的演讲Bayesian Statistical Analysis with Python
讲解了使用PyMC3进行基本的贝叶斯统计分析过程. 是很好的PyMC3和贝叶斯统计分析的入门教程.
# Imports
import pymc3 as pm # python的概率编程包
import numpy.random as npr # numpy是用来做科学计算的
import numpy as np
import matplotlib.pyplot as plt # matplotlib是用来画图的
import matplotlib as mpl

from collections import Counter # ?
import seaborn as sns # ?
# import missingno as msno # 用来应对缺失的数据

# Set plotting style
# plt.style.use('fivethirtyeight')
sns.set_style('white')
sns.set_context('poster')

%load_ext autoreload
%autoreload 2
%matplotlib inline
%config InlineBackend.figure_format = 'retina'

import warnings
warnings.filterwarnings('ignore')
使用python进行贝叶斯统计分析
Eric J. Ma, MIT Biological Engineering, Insight Health Data Science Fellow, NIBR Data Science
PyCon 2017, Portland, OR; PyData Boston 2017, Boston, MA
- HTML Notebook on GitHub: ericmjl.github.io/bayesian-stats-talk
- Twitter: @ericmjl
本讲座优点
- 最少的专业术语:让我们专注于分析原理,而不是术语。 例如。 将不会解释A / B测试,spike & slab回归,共轭分布...
- 帕雷托原则:你需要的80%都是基本知识
- 享受讲座:专注于贝叶斯,以后再看代码!
假设已经掌握的知识
- 熟悉Python:
- 对象 & 方法
- context manager syntax
- 了解基本的统计学术语:
- mean: 均值
- variance: 方差
- interval: 置信区间

贝叶斯公式
- $ P(H|D)$:在给定数据的情况下, 假设为真的概率。(Probability that the hypothesis is true given the data.)
- $ P(D|H)$:假设为真时, 数据事件发生的概率。(Probability of the data arising given the hypothesis.)
- $ P(H)$:假设发生的概率。(Probability that the hypothesis is true, globally.)
- $ P(D)$:数据事件发生的概率。(Probability of the data arising, globally.)
贝叶斯主义者的思维方式
根据证据不断更新信念
常见的统计分析问题
- 参数估计: "真实值是否等于X"
- 比较两组实验数据: "实验组是否与对照组不同? "
例 1: 抛硬币问题
我把我的硬币抛了$ n $次,正面是$ h $次。 这枚硬币是有偏心的吗?
参数估计问题parameterized problem
“我想知道的是抛出正面的概率$ p $,假设$ n $次抛硬币中有$ h $次观察到是正面,$ p $的值是否足够接近$ 0.5 $,比如在$ [0.48,0.52] $?“
先验假设
- 对参数预先的假设分布: $ p \sim Uniform(0, 1) $
- likelihood function(似然函数, 翻译这词还不如英文原文呢): $ data \sim Bernoulli(p) $

# 产生所需要的数据
from random import shuffle
total = 30
n_heads = 11
n_tails = total - n_heads
tosses = [1] * n_heads + [0] * n_tails
shuffle(tosses)
数据
print(tosses)
def plot_coins():
    fig = plt.figure()
    ax = fig.add_subplot(1,1,1)
    ax.bar(list(Counter(tosses).keys()), list(Counter(tosses).values()))
    ax.set_xticks([0, 1])
    ax.set_xticklabels(['tails', 'heads'])
    ax.set_ylim(0, 20)
    ax.set_yticks(np.arange(0, 21, 5))
    return fig
fig = plot_coins()
plt.show()
代码
# Context manager syntax. `coin_model` is **just**
# a placeholder
with pm.Model() as coin_model:
    # Distributions are PyMC3 objects.
    # Specify prior using Uniform object.
    p_prior = pm.Uniform('p', 0, 1)

    # Specify likelihood using Bernoulli object.
    like = pm.Bernoulli('likelihood', p=p_prior,
                        observed=tosses)
                        # "observed=data" is key
                        # for likelihood.
MCMC Inference Button (TM)
with coin_model:
    # don't worry about this:
    step = pm.Metropolis()

    # focus on this, the Inference Button:
    coin_trace = pm.sample(2000, step=step)
结果
pm.traceplot(coin_trace)
plt.show()
pm.plot_posterior(coin_trace[100:], color='#87ceeb',
                  rope=[0.48, 0.52], point_estimate='mean',
                  ref_val=0.5)
plt.show()
- 95% highest posterior density (HPD, 大概类似于置信区间) 包含了 region of practical equivalence (ROPE, 实际等同区间).
- 需要更多的数据!
模式
- 使用统计分布参数化您的问题
- 修正你的模型结构
- 在PyMC3中编写模型,点击Inference 按钮TM
- 根据后验分布进行解释
- (可选)如果有新信息,修改模型结构。
例 2: 药品活性问题
我有一个新开发的分子X; X在阻止流感病毒复制方面有多好?
实验
测试X的浓度范围, 测量流感活性
计算 IC50: 能够抑制病毒复制活性50%的X浓度.
data

import numpy as np
chem_data = [(0.00080, 99),
(0.00800, 91),
(0.08000, 89),
(0.40000, 89),
(0.80000, 79),
(1.60000, 61),
(4.00000, 39),
(8.00000, 25),
(80.00000, 4)]

import pandas as pd

chem_df = pd.DataFrame(chem_data)
chem_df.columns = ['concentration', 'activity']
chem_df['concentration_log'] = chem_df['concentration'].apply(lambda x:np.log10(x))
# df.set_index('concentration', inplace=True)
参数化问题parameterized problem
给定数据, 求出化学物质的IC50值是多少, 并且求出置信区间( 原文中the uncertainty surrounding it, 后面看类似置信区间的含义)?
先验知识
- 由药学知识已知测量函数(measurement function): $ m = \frac{\beta}{1 + e^{x - IC_{50}}} $
- 测量函数中的参数估计, 来自先验知识: $ \beta \sim HalfNormal(100^2) $
- 关于感兴趣参数的先验知识: $ log(IC_{50}) \sim ImproperFlat $
- likelihood function: $ data \sim N(m, 1) $

数据
def plot_chemical_data(log=True):
    fig = plt.figure(figsize=(10,6))
    ax = fig.add_subplot(1,1,1)
    if log:
        ax.scatter(x=chem_df['concentration_log'], y=chem_df['activity'])
        ax.set_xlabel('log10(concentration (mM))', fontsize=20)
    else:
        ax.scatter(x=chem_df['concentration'], y=chem_df['activity'])
        ax.set_xlabel('concentration (mM)', fontsize=20)
    ax.set_xticklabels([int(i) for i in ax.get_xticks()], fontsize=18)
    ax.set_yticklabels([int(i) for i in ax.get_yticks()], fontsize=18)

    plt.hlines(y=50, xmin=min(ax.get_xlim()), xmax=max(ax.get_xlim()), linestyles='--',)
    return fig
fig = plot_chemical_data(log=True)
plt.show()
代码
with pm.Model() as ic50_model: # 都是以这句开头, with pm.Models() as 自己取个名字:
    beta = pm.HalfNormal('beta', sd=100**2) # 每个参数需要规定分布, 用pm.xxx定义了分布函数
    ic50_log10 = pm.Flat('IC50_log10')  # Flat prior
    # MATH WITH DISTRIBUTION OBJECTS! # 测量函数的计算过程, 这个也是来自于先验知识
    measurements = beta / (1 + np.exp(chem_df['concentration_log'].values -
                                      ic50_log10))

    y_like = pm.Normal('y_like', mu=measurements,
                       observed=chem_df['activity']) # 这是啥?
    # Deterministic transformations.
    ic50 = pm.Deterministic('IC50', np.power(10, ic50_log10)) # ic50_log10是在对数域, 要转换回来
MCMC Inference Button (TM)
with ic50_model: # 在之前定义的模型中模拟
    step = pm.Metropolis() # 标准步骤, 照写
    ic50_trace = pm.sample(100000, step=step) # 随机模拟过程, 重采样的次数手工指定
pm.traceplot(ic50_trace[2000:], varnames=['IC50_log10', 'IC50'])  # live: sample from step 2000 onwards.
plt.show()
结果
pm.plot_posterior(ic50_trace[4000:], varnames=['IC50'],
                  color='#87ceeb', point_estimate='mean')
plt.show()
该化学物质的 IC50 大约在[2 mM, 2.4 mM] (95% HPD). 这不是个好的药物候选者. 在这个问提上不确定性影响不大, 看看单位数量级就知道IC50在毫摩的物质没什么用...
第二类问题: 实验组之间的比较
"实验组和对照组之间是否有差别? "
例 1: 药品对IQ的影响问题
药品治疗是否影响(提高)IQ分数?
(documented in Kruschke, 2013, example modified from PyMC3 documentation)
drug = [  99.,  110.,  107.,  104.,  103.,  105.,  105.,  110.,   99.,
        109.,  100.,  102.,  104.,  104.,  100.,  104.,  101.,  104.,
        101.,  100.,  109.,  104.,  105.,  112.,   97.,  106.,  103.,
        101.,  101.,  104.,   96.,  102.,  101.,  100.,   92.,  108.,
         97.,  106.,   96.,   90.,  109.,  108.,  105.,  104.,  110.,
         92.,  100.]

placebo = [  95.,  105.,  103.,   99.,  104.,   98.,  103.,  104.,  102.,
         91.,   97.,  101.,  100.,  113.,   98.,  102.,  100.,  105.,
         97.,   94.,  104.,   92.,   98.,  105.,  106.,  101.,  106.,
        105.,  101.,  105.,  102.,   95.,   91.,   99.,   96.,  102.,
         94.,   93.,   99.,   99.,  113.,   96.]

def ECDF(data):
    x = np.sort(data)
    y = np.cumsum(x) / np.sum(x)

    return x, y

def plot_drug():
    fig = plt.figure()
    ax = fig.add_subplot(1,1,1)
    x_drug, y_drug = ECDF(drug)
    ax.plot(x_drug, y_drug, label='drug, n={0}'.format(len(drug)))
    x_placebo, y_placebo = ECDF(placebo)
    ax.plot(x_placebo, y_placebo, label='placebo, n={0}'.format(len(placebo)))
    ax.legend()
    ax.set_xlabel('IQ Score')
    ax.set_ylabel('Cumulative Frequency')
    ax.hlines(0.5, ax.get_xlim()[0], ax.get_xlim()[1], linestyle='--')

    return fig
# Eric Ma自己很好奇, 从频率主义的观点, 差别是否已经是具有"具有统计学意义"

from scipy.stats import ttest_ind

ttest_ind(drug, placebo) # (非配对) t检验. P=0.025, 已经<0.05了
实验
- 参与者被随机分为两组:
给药组vs.安慰剂组
- 测量参与者的IQ分数
先验知识
- 被测数据符合t分布: $ data \sim StudentsT(\mu, \sigma, \nu) $
以下为t分布的几个参数:
- 均值符合正态分布: $ \mu \sim N(0, 100^2) $
- 自由度(degrees of freedom)符合指数分布: $ \nu \sim Exp(30) $
- 方差是positively-distributed: $ \sigma \sim HalfCauchy(100^2) $

数据
fig = plot_drug()
plt.show()
代码
y_vals = np.concatenate([drug, placebo])
labels = ['drug'] * len(drug) + ['placebo'] * len(placebo)

data = pd.DataFrame([y_vals, labels]).T
data.columns = ['IQ', 'treatment']
with pm.Model() as kruschke_model:
    # Focus on the use of Distribution Objects.
    # Linking Distribution Objects together is done by
    # passing objects into other objects' parameters.

    # 标准建模动作, 用pm.Xxx指定先验知识, 也就是各个参数的分布
    # 注意给药组和对照组的参数要分开单独设定,
    mu_drug = pm.Normal('mu_drug', mu=0, sd=100**2)
    mu_placebo = pm.Normal('mu_placebo', mu=0, sd=100**2)
    sigma_drug = pm.HalfCauchy('sigma_drug', beta=100)
    sigma_placebo = pm.HalfCauchy('sigma_placebo', beta=100)
    nu = pm.Exponential('nu', lam=1/29) + 1

    # 代入参数, 为两组的分布建模
    drug_like = pm.StudentT('drug', nu=nu, mu=mu_drug,
                            sd=sigma_drug, observed=drug)
    placebo_like = pm.StudentT('placebo', nu=nu, mu=mu_placebo,
                               sd=sigma_placebo, observed=placebo)

    # 计算组间均值的差距
    diff_means = pm.Deterministic('diff_means', mu_drug - mu_placebo)

    # 这俩是啥?
    pooled_sd = pm.Deterministic('pooled_sd',
                                 np.sqrt(np.power(sigma_drug, 2) +
                                         np.power(sigma_placebo, 2) / 2))
    effect_size = pm.Deterministic('effect_size',
                                   diff_means / pooled_sd)
MCMC Inference Button (TM)
with kruschke_model:
    kruschke_trace = pm.sample(10000, step=pm.Metropolis()) # 标准动作, 照写
结果
pm.traceplot(kruschke_trace[2000:],
             varnames=['mu_drug', 'mu_placebo'])
plt.show()
pm.plot_posterior(kruschke_trace[2000:], color='#87ceeb',
            varnames=['mu_drug', 'mu_placebo', 'diff_means'])
plt.show()
- IQ均值的差距为: [0.5, 4.6]
- 频率主义的 p-value: $ 0.02 $ (!!!!!!!!)
注: IQ的差异在10以上才有点意义. p-value=0.02说明组间有差异, 但没说差异有多大. 这个故事说的是虽然有差异, 但是差异太小了, 也没啥意思.
def get_forestplot_line(ax, kind):
    widths = {'median': 2.8, 'iqr': 2.0, 'hpd': 1.0}
    assert kind in widths.keys() #f'line kind must be one of {widths.keys()}'
    lines = []
    for child in ax.get_children():
        if isinstance(child, mpl.lines.Line2D) and np.allclose(child.get_lw(), widths[kind]):
            lines.append(child)
    return lines

def adjust_forestplot_for_slides(ax):
    for line in get_forestplot_line(ax, kind='median'):
        line.set_markersize(10)

    for line in get_forestplot_line(ax, kind='iqr'):
        line.set_linewidth(5)

    for line in get_forestplot_line(ax, kind='hpd'):
        line.set_linewidth(3)

    return ax
pm.forestplot(kruschke_trace[2000:],
          varnames=['mu_drug', 'mu_placebo'])
ax = plt.gca()
ax = adjust_forestplot_for_slides(ax)
plt.show()
森林图:在同一轴上的95%HPD(细线),IQR(粗线)和后验分布的中位数(点),使我们能够直接比较治疗组和对照组。
def overlay_effect_size(ax):
    height = ax.get_ylim()[1] * 0.5
    ax.hlines(height, 0, 0.2, 'red', lw=5)
    ax.hlines(height, 0.2, 0.8, 'blue', lw=5)
    ax.hlines(height, 0.8, ax.get_xlim()[1], 'green', lw=5)
ax = pm.plot_posterior(kruschke_trace[2000:],
                       varnames=['effect_size'],
                       color='#87ceeb')
overlay_effect_size(ax)
- 效果大小(Cohen's d, 效果微小, 效果中等, 效果很大)可以从微小到很大(95%HPD [0.0,0.77])。
- 智商提高0-4分。
- 这种药很可能是无关紧要的。
- 没有生物学意义的证据。
例 2: 手机消毒问题
比较两种常用的消毒方法, 和我的fancy方法, 哪种消毒方法更好
实验设计
- 将手机随机分到6组: 4 "fancy" 方法 + 2 "control" 方法.
- 处理前后对手机表面进行拭子菌培养
- count 菌落数量, 比较处理前后的菌落计数
renamed_treatments = dict()
renamed_treatments['FBM_2'] = 'FM1'
renamed_treatments['bleachwipe'] = 'CTRL1'
renamed_treatments['ethanol'] = 'CTRL2'
renamed_treatments['kimwipe'] = 'FM2'
renamed_treatments['phonesoap'] = 'FM3'
renamed_treatments['quatricide'] = 'FM4'

# Reload the data one more time.
data = pd.read_csv('datasets/smartphone_sanitization_manuscript.csv', na_values=['#DIV/0!'])
del data['perc_reduction colonies']

# Exclude cellblaster data
data = data[data['treatment'] != 'CB30']
data = data[data['treatment'] != 'cellblaster']

# Rename treatments
data['treatment'] = data['treatment'].apply(lambda x: renamed_treatments[x])

# Sort the data according to the treatments.
treatment_order = ['FM1', 'FM2', 'FM3', 'FM4', 'CTRL1', 'CTRL2']
data['treatment'] = data['treatment'].astype('category')
data['treatment'].cat.set_categories(treatment_order, inplace=True)
data['treatment'] = data['treatment'].cat.codes.astype('int32')
data = data.sort_values(['treatment']).reset_index(drop=True)
data['site'] = data['site'].astype('category').cat.codes.astype('int32')

data['frac_change_colonies'] = ((data['colonies_post'] - data['colonies_pre'])
                                / data['colonies_pre'])
data['frac_change_colonies'] = pm.floatX(data['frac_change_colonies'])
del data['screen protector']

# Change dtypes to int32 for GPU usage.
def change_dtype(data, dtype='int32'):
    return data.astype(dtype)

cols_to_change_ints = ['sample_id', 'colonies_pre', 'colonies_post',
                       'morphologies_pre', 'morphologies_post', 'phone ID']

cols_to_change_floats = ['year', 'month', 'day', 'perc_reduction morph',
                         'phone ID', 'no case',]

for col in cols_to_change_ints:
    data[col] = change_dtype(data[col], dtype='int32')

for col in cols_to_change_floats:
    data[col] = change_dtype(data[col], dtype='float32')

data.dtypes


# # filter the data such that we have only PhoneSoap (PS-300) and Ethanol (ET)
# data_filtered = data[(data['treatment'] == 'PS-300') | (data['treatment'] == 'QA')]
# data_filtered = data_filtered[data_filtered['site'] == 'phone']
# data_filtered.sample(10)
数据
def plot_colonies_data():
    fig = plt.figure(figsize=(10,5))
    ax1 = fig.add_subplot(2,1,1)
    sns.swarmplot(x='treatment', y='colonies_pre', data=data, ax=ax1)
    ax1.set_title('pre-treatment')
    ax1.set_xlabel('')
    ax1.set_ylabel('colonies')
    ax2 = fig.add_subplot(2,1,2)
    sns.swarmplot(x='treatment', y='colonies_post', data=data, ax=ax2)
    ax2.set_title('post-treatment')
    ax2.set_ylabel('colonies')
    ax2.set_ylim(ax1.get_ylim())
    plt.tight_layout()
    return fig
fig = plot_colonies_data()
plt.show()
先验知识
菌落计数符合泊松Poisson分布. 因此...
- 菌落计数符合泊松分布: $ data_{i}^{j} \sim Poisson(\mu_{i}^{j}), j \in [pre, post], i \in [1, 2, 3...] $
- 泊松分布的参数是离散均匀分布: $ \mu_{i}^{j} \sim DiscreteUniform(0, 10^{4}), j \in [pre, post], i \in [1, 2, 3...] $
- 灭菌效力通过百分比变化测量,定义如下: $ \frac{mu_{pre} - mu_{post}}{mu_{pre}} $

代码
with pm.Model() as poisson_estimation:

    mu_pre = pm.DiscreteUniform('pre_mus', lower=0, upper=10000,
                                shape=len(treatment_order))
    pre_mus = mu_pre[data['treatment'].values]  # fancy indexing!!
    pre_counts = pm.Poisson('pre_counts', mu=pre_mus,
                            observed=pm.floatX(data['colonies_pre']))

    mu_post = pm.DiscreteUniform('post_mus', lower=0, upper=10000,
                                 shape=len(treatment_order))
    post_mus = mu_post[data['treatment'].values]  # fancy indexing!!
    post_counts = pm.Poisson('post_counts', mu=post_mus,
                             observed=pm.floatX(data['colonies_post']))

    perc_change = pm.Deterministic('perc_change',
                                   100 * (mu_pre - mu_post) / mu_pre)
MCMC Inference Button (TM)
with poisson_estimation:
    poisson_trace = pm.sample(200000)
pm.traceplot(poisson_trace[50000:], varnames=['pre_mus', 'post_mus'])
plt.show()
结果
pm.forestplot(poisson_trace[50000:], varnames=['perc_change'],
              ylabels=treatment_order) #, xrange=[0, 110])
plt.xlabel('Percentage Reduction')

ax = plt.gca()
ax = adjust_forestplot_for_slides(ax)
第三类问题: 复杂的东西
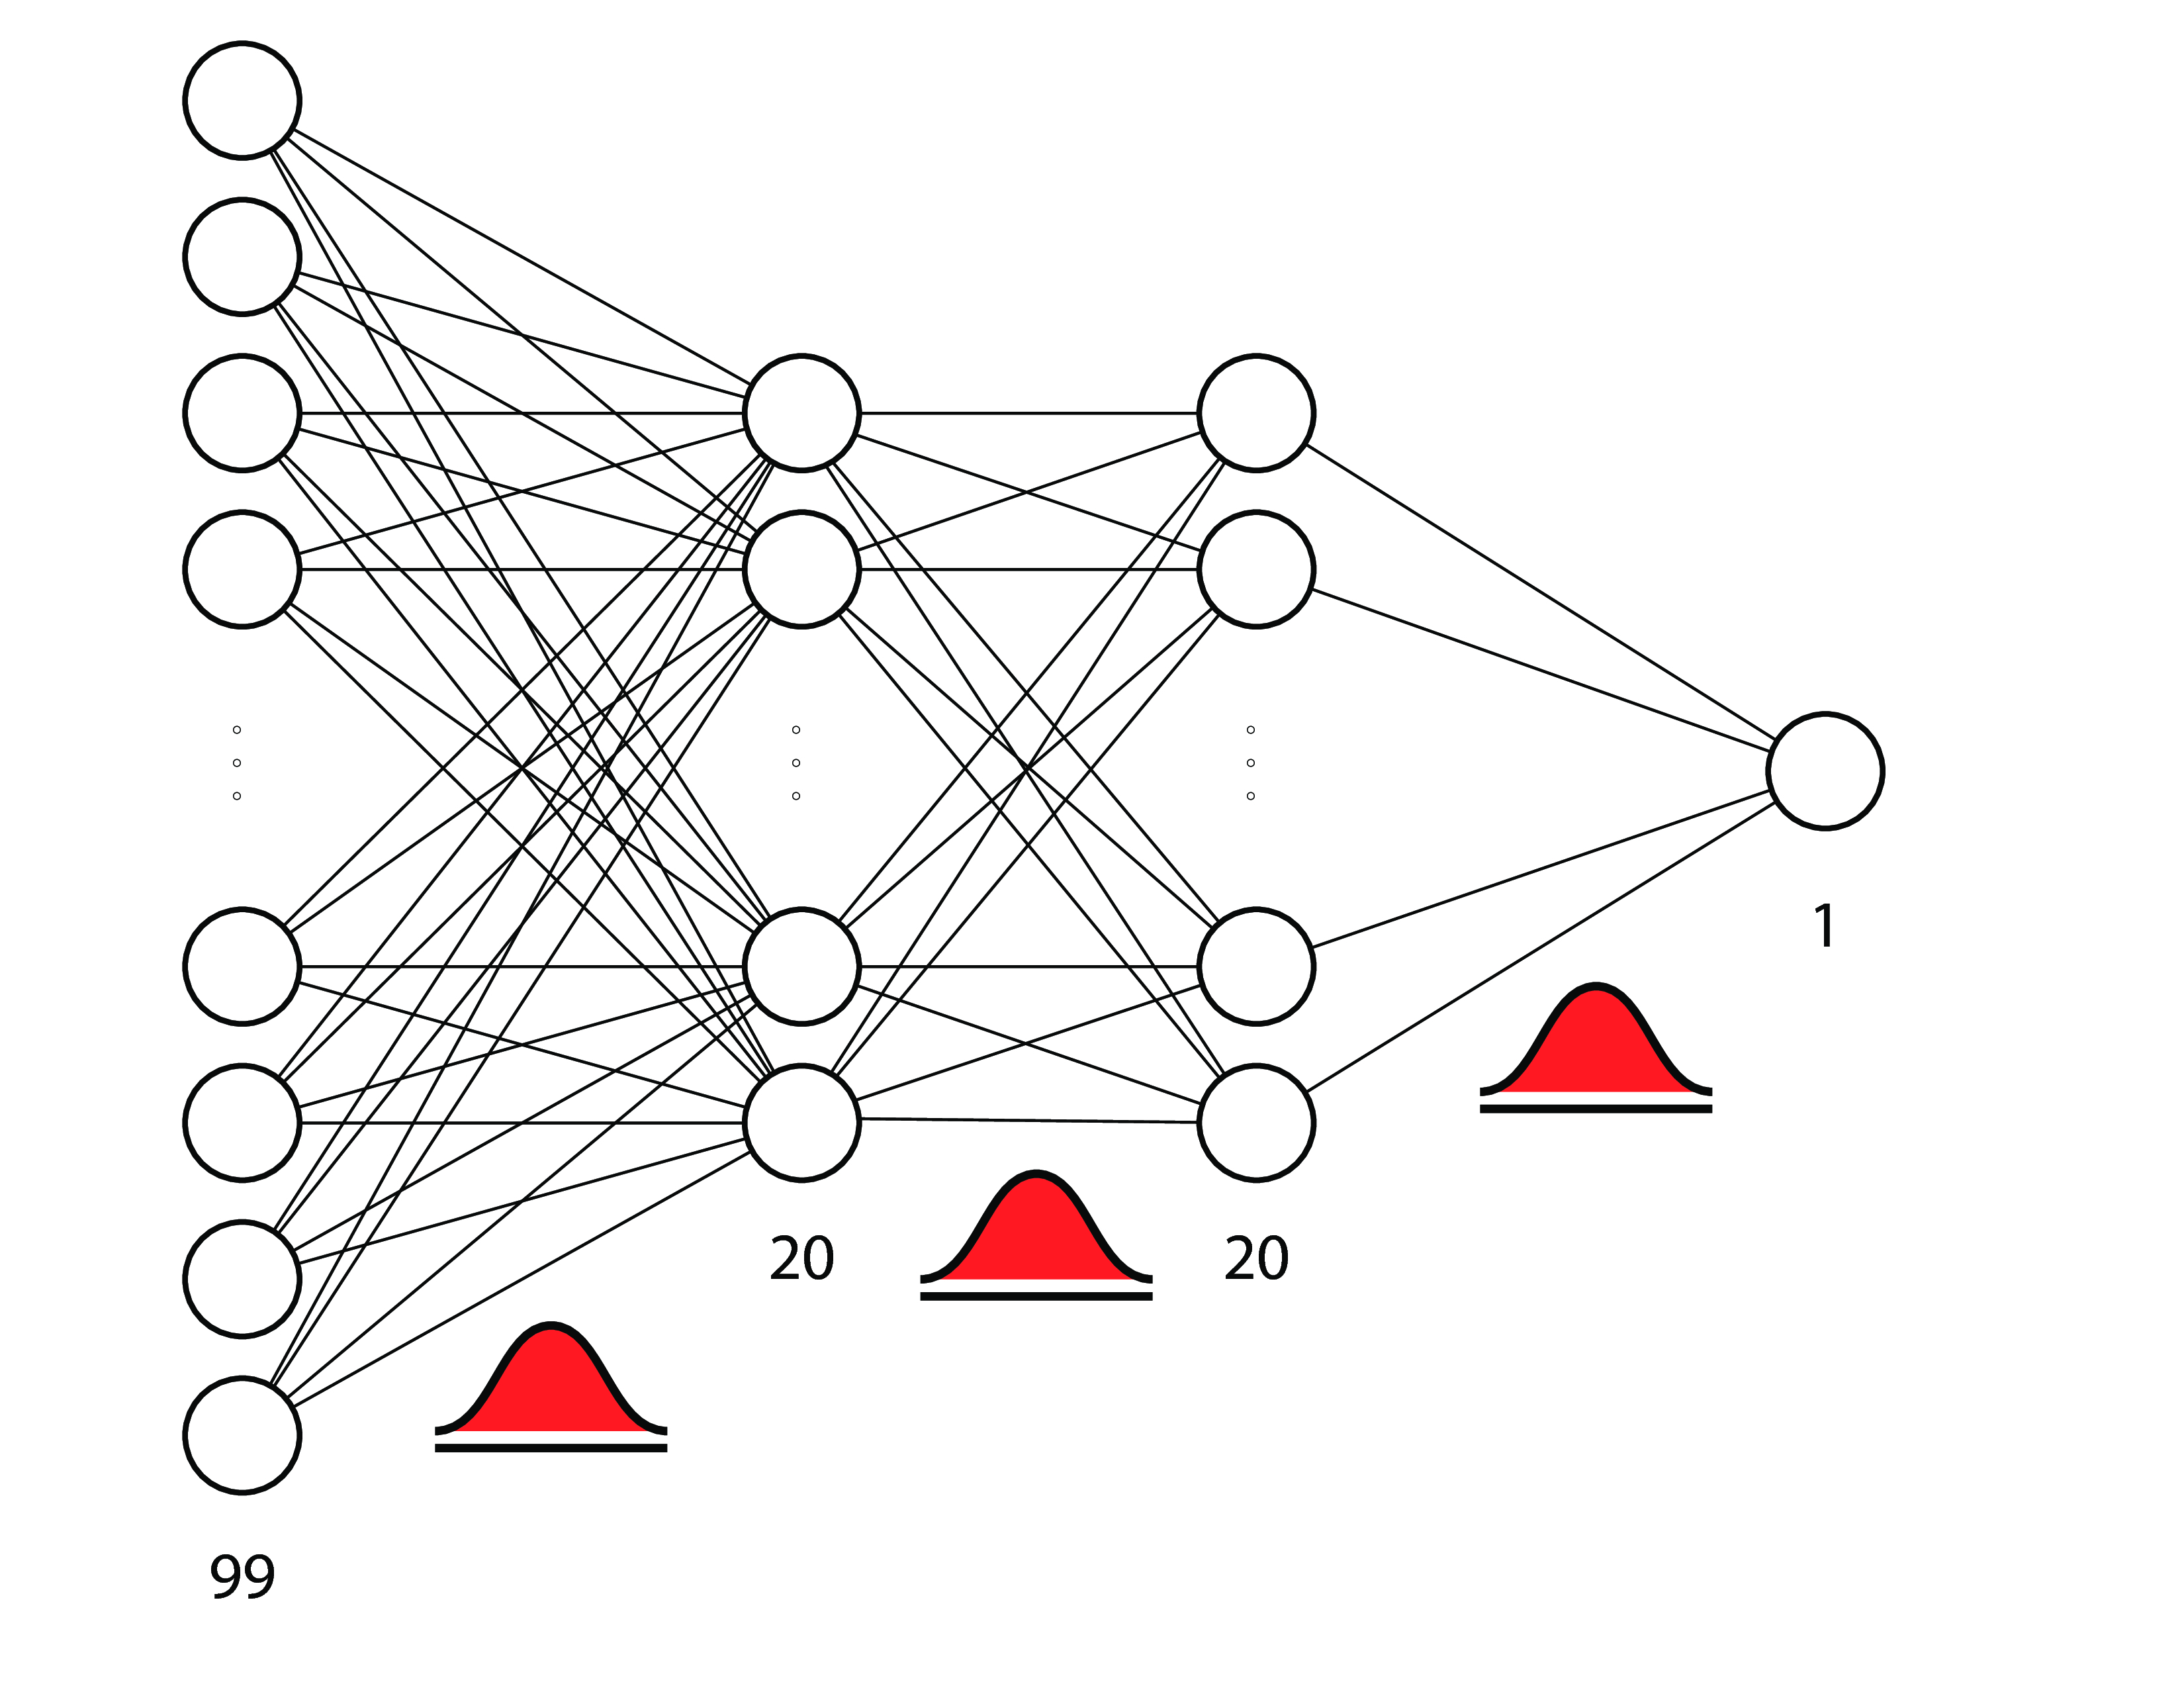
例子: 贝叶斯神经网络
a.k.a. 贝叶斯深度学习

注: 这好像跳到另一个课件去了. 有时间我也挪过来翻译
概念特征
- 参数估计:
- 抛硬币: 先验与后验
- IC 50 </ sub>:连接函数与确定性计算
- 对照与治疗:
- 药物智商:一个治疗组 与 一个对照组
- 电话消毒:多个治疗组 与 多个对照组。
- 贝叶斯神经网络:
- 森林覆盖:先验参数和大致推断。
模式
- 使用统计分布参数化您的问题
- 修正你的模型结构
- 在PyMC3中编写模型,点击Inference 按钮TM
- 根据后验分布进行解释
- (可选)如果有新信息,修改模型结构。
贝叶斯估计
- 为数据的生成写一个描述性的模型。
- 原始的贝叶斯:在看到你的数据之前 做这个。
- 经验贝叶斯:在看到你的数据之后做这个。
- 估计感兴趣的模型参数的后验分布。
- 确定性计算 派生参数的后验分布。
参考资源
- John K. Kruschke's books, paper, and video.
- Statistical Re-thinking book
- Jake Vanderplas' blog post on the differences between Frequentism and Bayesianism.
- PyMC3 examples & documentation
- Andrew Gelman's blog
- Recommendations for prior distributions wiki
- Cam Davidson-Pilon's Bayesian Methods for Hackers
- My repository of Bayesian data analysis recipes.
GO BAYES!
- Full notebook with bonus resources: https://github.com/ericmjl/bayesian-stats-talk
- Twitter: @ericmjl
- Website: ericmjl.com
